Giving complex ideas
a clear form.
Izgi Uygur Studio turns research, data, and big ideas into annual and impact reports, data visualizations, and pitch decks for mission-driven organizations and startups. Grounded in a decade of work across climate, cities, and science.
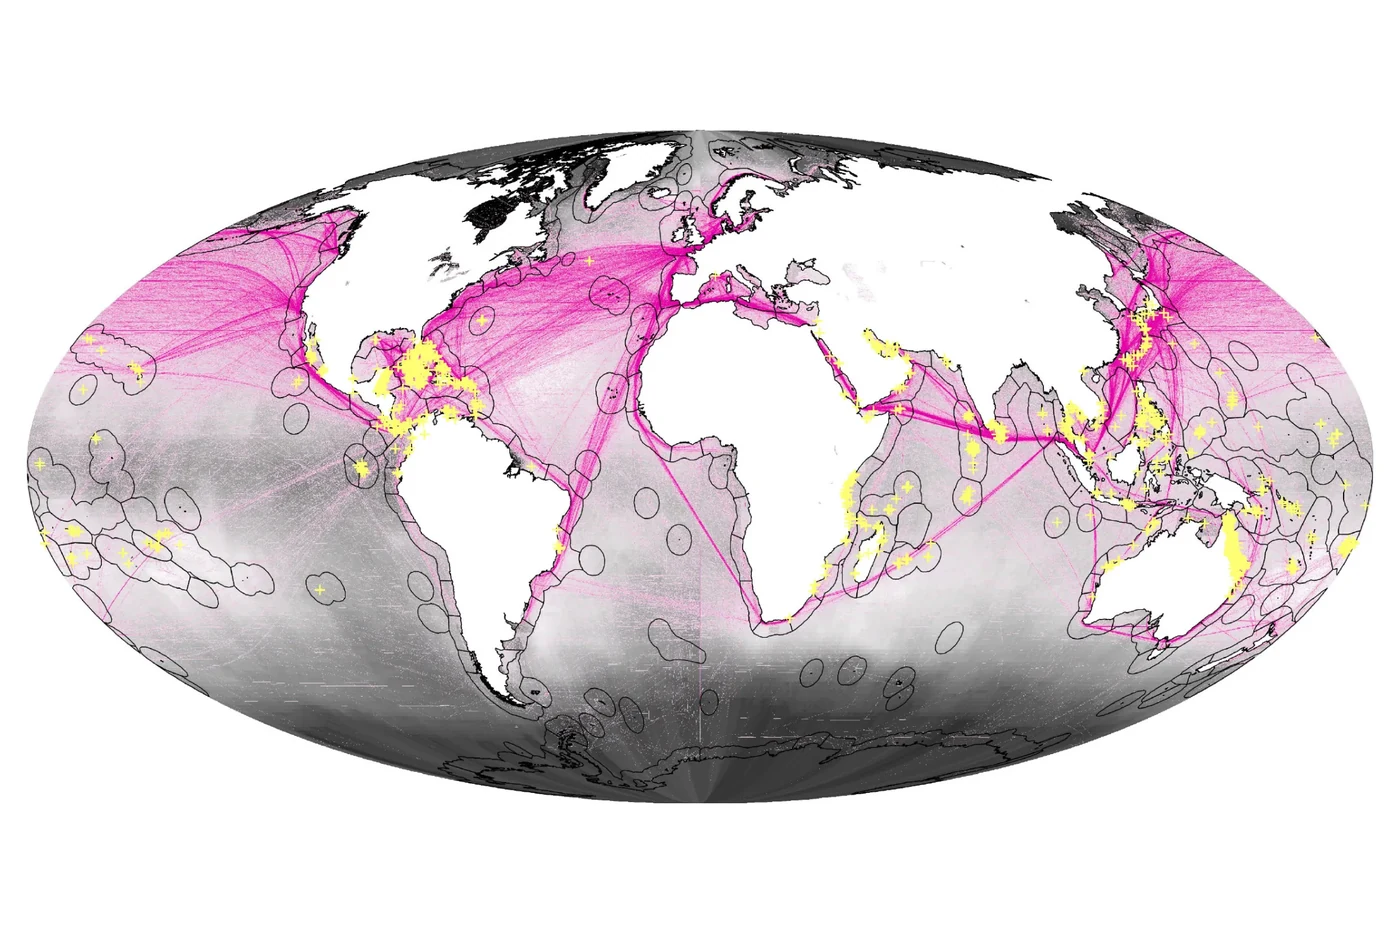
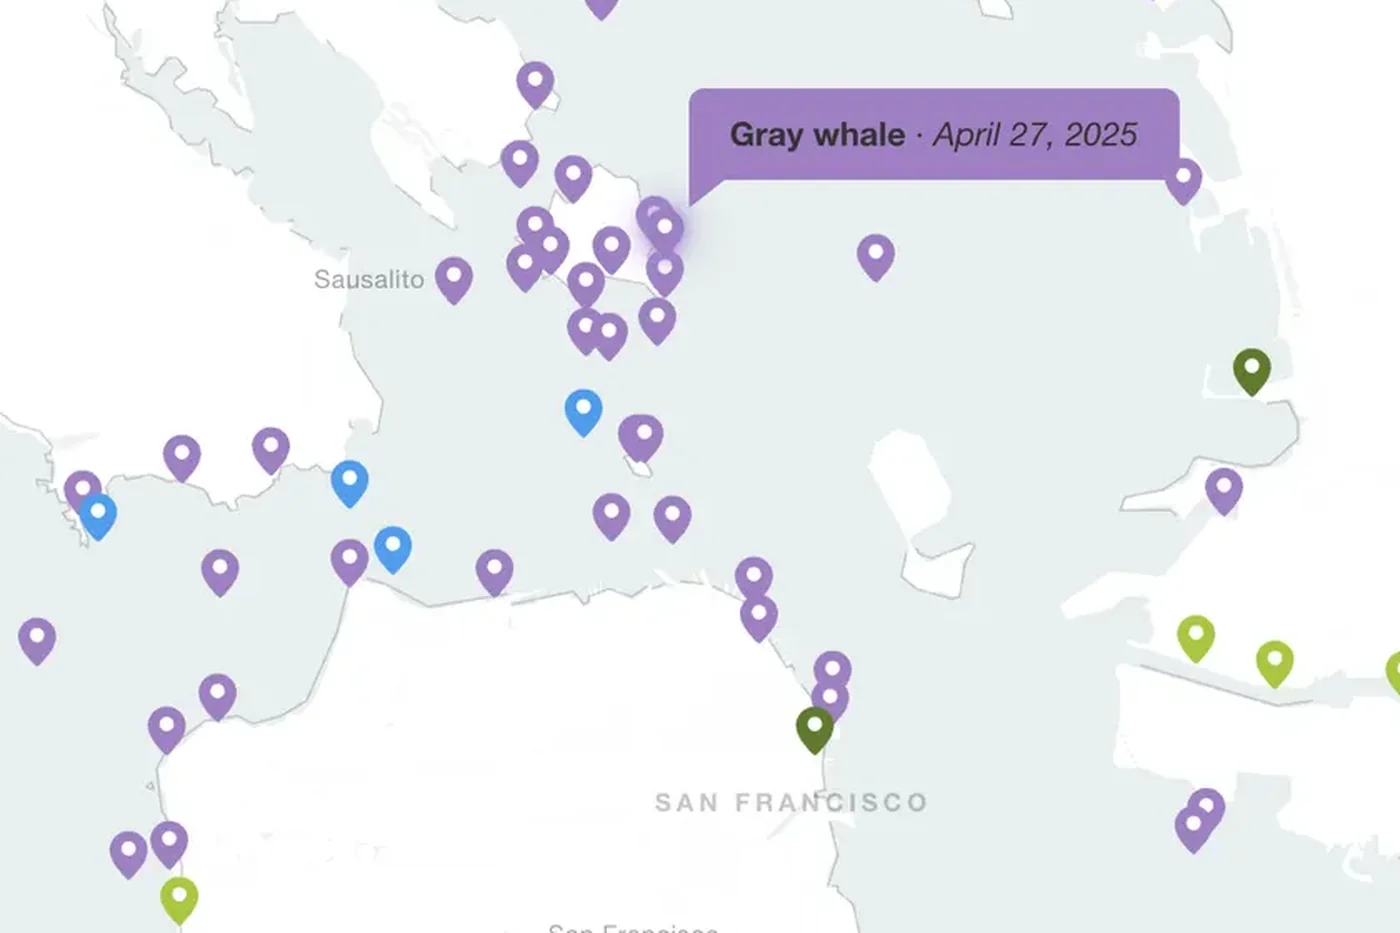


Bay Whale Strandings
baywhales.org →An interactive map of whale strandings across the San Francisco Bay Area.

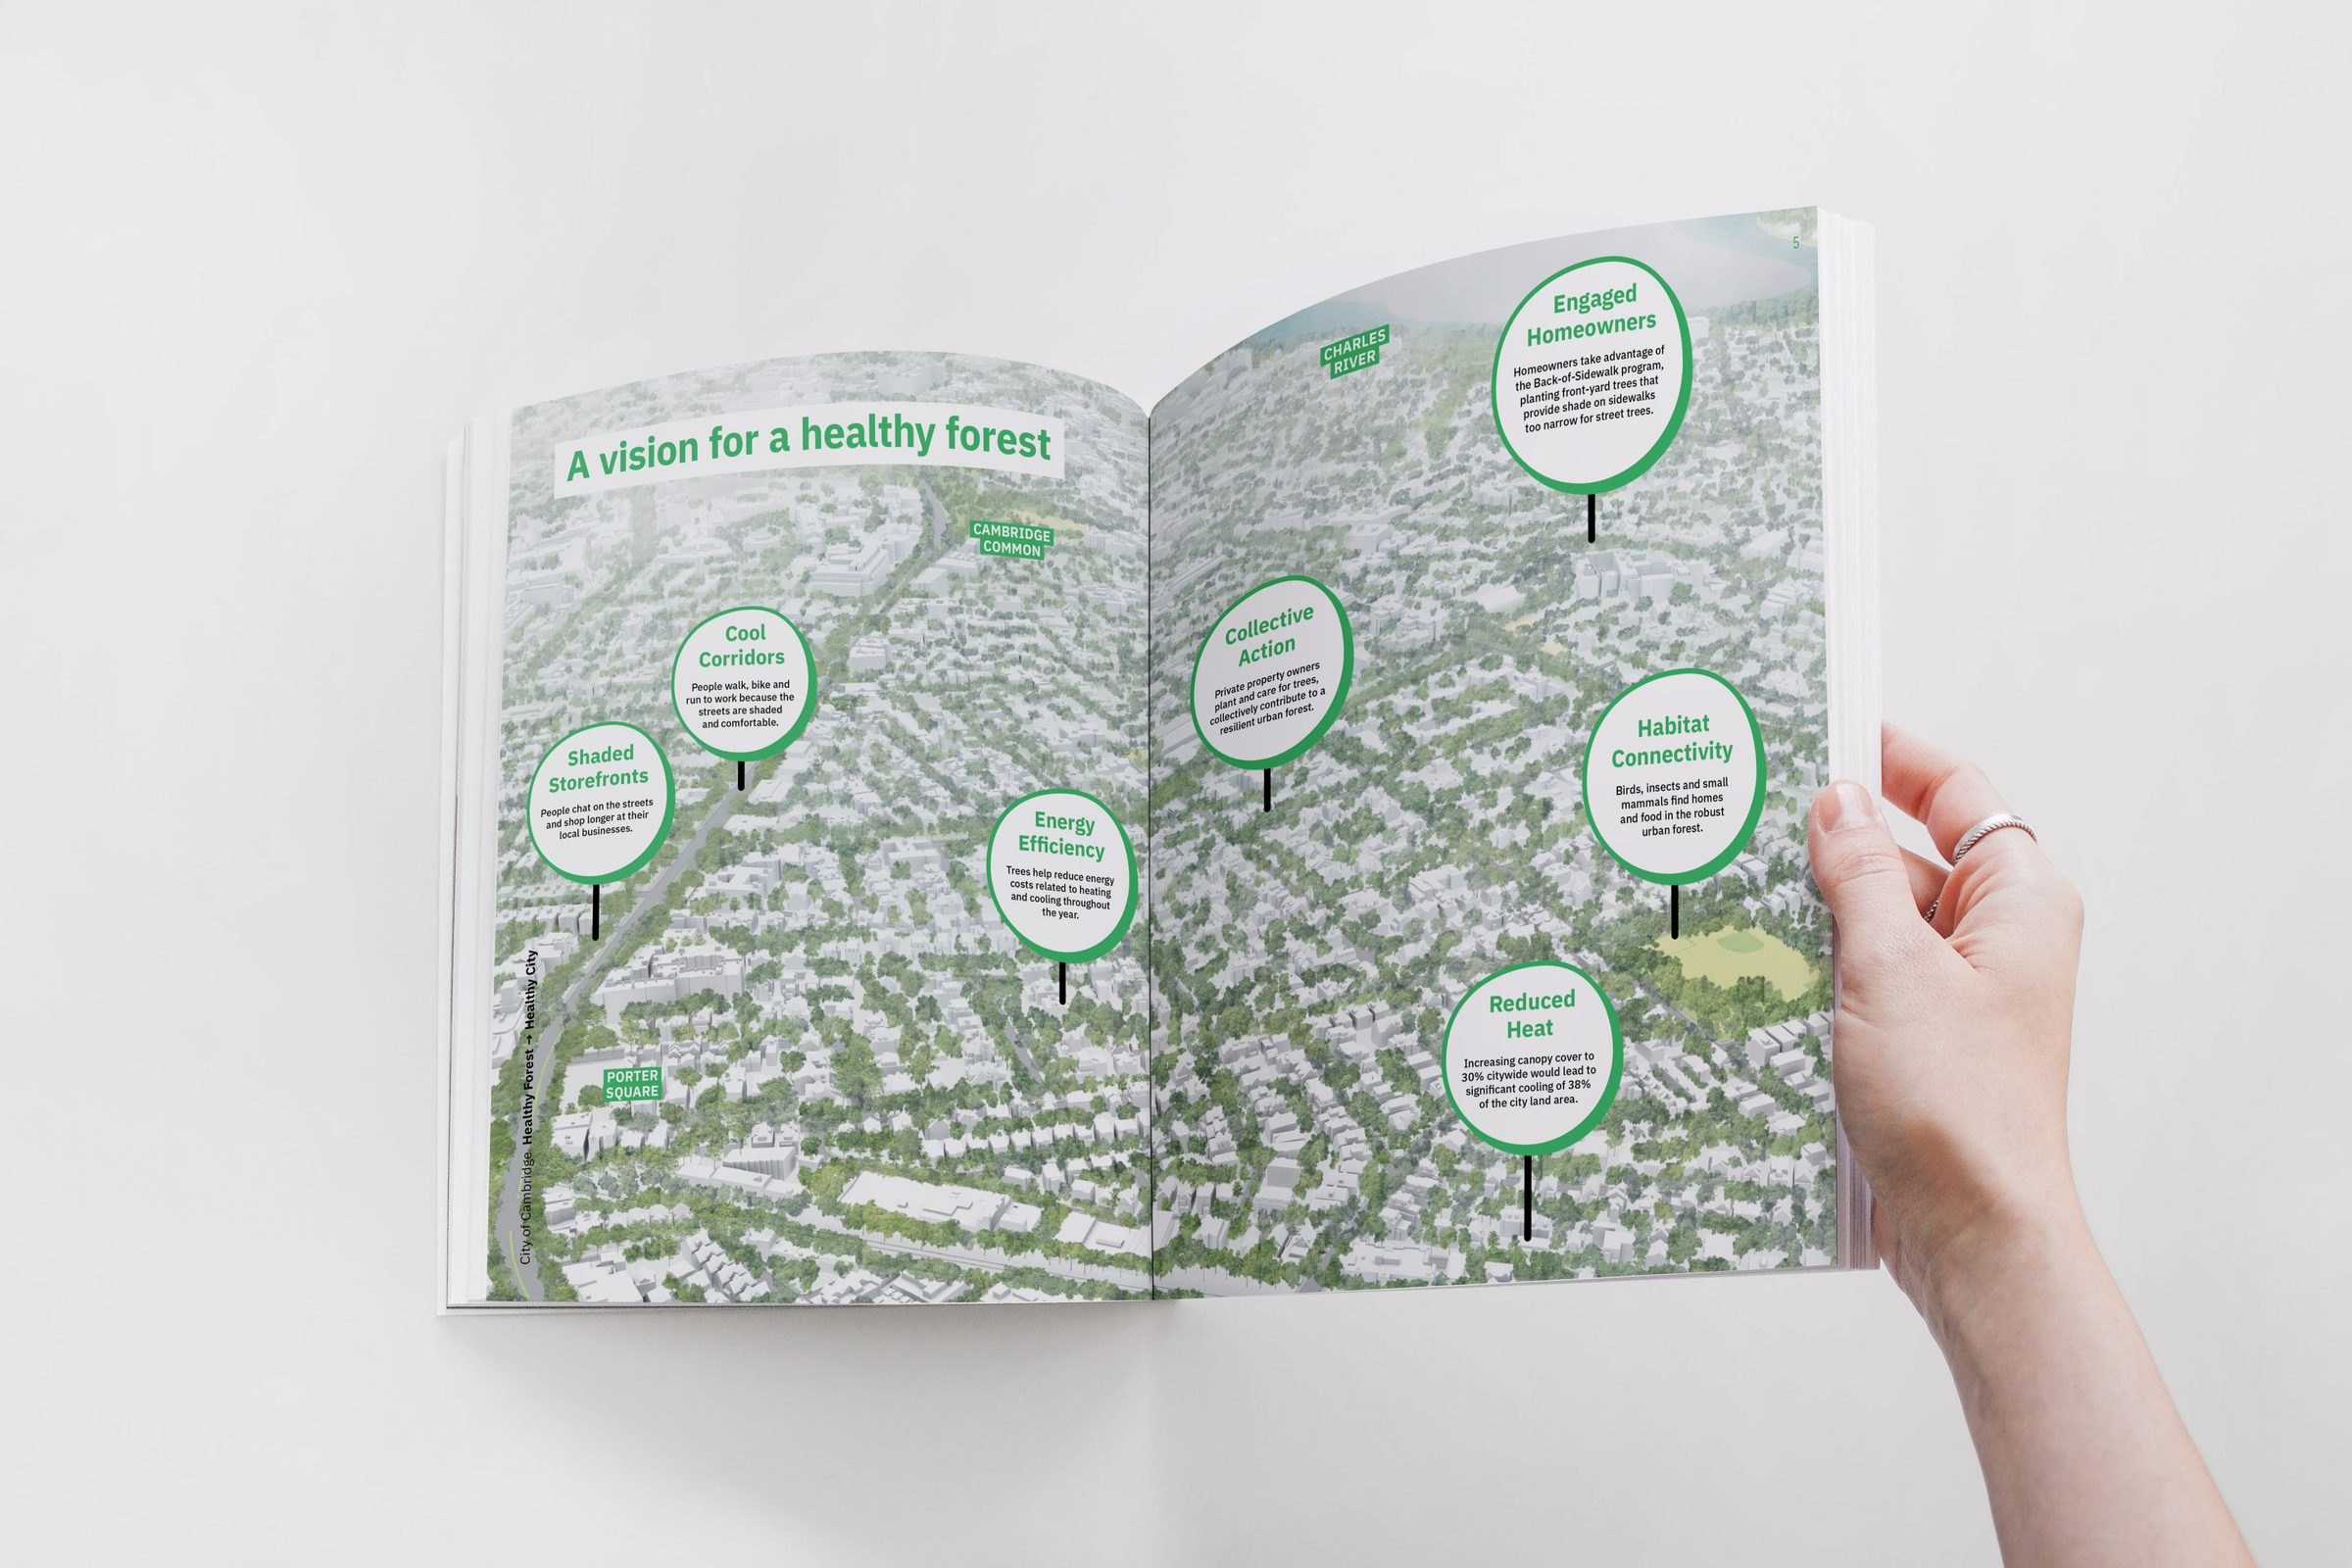
Cambridge Urban Forest Master Plan
View project →A multi-year plan to prepare Cambridge's urban forest for a changing climate.
Sensemaking.
Finding the patterns, gaps, questions, and meaning inside complex research and data.
Design.
Giving that information structure through visual systems, data visualization, interfaces, and information design.
Story.
Turning it into something people can understand, remember, share, and act on.

Research and data about complex systemsThe systems I work withOcean · Climate · Ecology · Cities · Science · AI · Data, from environmental change to emerging technologies, are often difficult to access, navigate, or understand. I work with that complexity to find the structure, story, and visual form that make the information clearer, more usable, and more meaningful across different audiencesWho it’s forNonprofits & foundations · Sustainability and impact teams · Strategy consultancies · Startups raising capital · Research institutions.
Annual, Impact & Sustainability Reports
Annual report, impact report, and sustainability report design for complex research, metrics, and stories, shaped into clear, engaging publications for print and digital.
Data Visualization & Data Storytelling
Data visualization and data storytelling for research and datasets, using charts, maps, and interactive stories to make information easier to understand and trust.
Pitch Decks & Presentations
Pitch deck and presentation design that brings complex ideas into a clear narrative, strong structure, and polished visual system.
 copy 3.webp)
“Izgi helped with our product’s UX, our fundraising pitch deck, our messaging. She understood the business goals and advocated for the user very effectively.”
“Izgi carved a special, inclusive environment early on in the AI space. She is an engaging community leader with initiative, thoughtful and professional, and a fantastic artistic talent herself.”